Climate Greenhouse Warming Equation Wrong

by VM44 56 Replies latest jw friends

  • besty
    besty

    The peer review process seems to be working just fine. One reviewer said:

    ”The overall concluding statement that ‘the existence of a stable climate requires a unique surface upward flux density and a unique optical depth of 1.841’ makes absolutely no sense at all. An atmosphere can be in stable radiative equilibrium for any LW optical depth, but the equilibrium surface temperature will monotonically depend on the value of the optical depth….”

    A brief overview of the major problems with the Miskolczi analysis can be found here http://www.realclimate.org/wiki/index.php?title=Ferenc_Miskolczi

    And an extensive scientific discussion of the assumptive errors in the analysis here http://rabett.blogspot.com/2008/06/gigo-eli-has-learned-over-years-that.html

    Two points:

    1 - Alternative viewpoints are available and subject to a largely effective peer review process - there is no conspiracy of silencing "non-conforming" outliers

    2 - The scientist(s) that overturn 150 years of greenhouse gas theory will be more famous than Einstein, Newton and Darwin combined.

  • frankiespeakin
    frankiespeakin

    Vm44,

    Thanks I find it very interesting, I'm interested in a mathematical model that can make more accurate prediction even though I don't comprehend in great depth the complexity involved.

    B-Rock,

    Thanks for posting that essay, it makes a point that I have been aware of in these debates for a long time. I do hold out that some day some mathematical genius will come along and figure out how to extrapolate the data into a workable mathematical model that makes accurate predictions.

    It will probably be something like what Richard Feynman said about the The Copenhagen interpretation of quantum mechanics: " if anybody says they understand quantum mechanics they don't understand quantum mechanics" and his famous sentence: "Shut up and calculate" In other words you don't have to understand how or why it works so use the calculation

    It definitely won't be simple Physics but they still could find a good model that works.

  • besty
    besty
    bottom line ... THE SUN WARMS THE EARTH ... needa graph for that?

    WAC - questions for you:

    1 - How do you account for rising CO2 levels NOT warming the planet? (clue: WAC the Internet conspiracy theorist v 150 years of science)

    2 - How do you account for the divergence in the correlation between solar activity and global temperature since 1975?

  • What-A-Coincidence
    What-A-Coincidence

    simple...they made a mistake by measureing from celsius to farenheigt thus u get wac #'s ;-)

  • besty
    besty

    BRock - you pasted an article entitled The Unbearable Complexity of Climate.

    The title evokes an argument from personal incredulity fallacy - 'this is really complicated, we (I) can't possibly hope to understand it, therefore it's not possible'. Also the title reminds me of Michael Behe's 'irreducible complexity'' argument for creationism but I digress...

    The key point of the article appears to be:

    For example, simple physics predicts a simple linear relationship between the climate forcings and the temperature. People seriously believe that a change of X in the forcings will lead inevitably to a chance of A * X in the temperature. This is called the “climate sensitivity”, and is a fundamental assumption in the climate models. The IPCC says that if CO2 doubles, we will get a rise of around 3C in the global temperature. However, there is absolutely no evidence to support that claim, only computer models. But the models assume this relationship, so they cannot be used to establish the relationship.

    I have to say this borders on deliberate lying. There is a wealth of empirical evidence not including models to support climate sensitivity ranges.

    • Lorius 1990 examined Vostok ice core data and calculates a range of 3 to 4°C.
    • Hoffert 1992 reconstructs two paleoclimate records (one colder, one warmer) to yield a range 1.4 to 3.2°C.
    • Hansen 1993 looks at the last 20,000 years when the last ice age ended and empirically calculates a climate sensitivity of 3 ± 1°C.
    • Gregory 2002 used observations of ocean heat uptake to calculate a minimum climate sensitivity of 1.5.
    • Chylek 2007 examines the period from the Last Glacial Maximum to Holocene transition. They calculate a climate sensitivy range of 1.3°C and 2.3°C.
    • Tung 2007 performs statistical analysis on 20th century temperature response to the solar cycle to calculate a range 2.3 to 4.1°C.

    Extensive discussion on this can be found here http://www.skepticalscience.com/climate-sensitivity.htm

  • What-A-Coincidence
    What-A-Coincidence

    beast master said: empirical

    i don't think u know what means, u just trying to sound smart like barack bin ladin obama

  • besty
    besty

    Empirical Evidence in Scientific Research

    Scientific evidence is considered empirical when it can be observed by many people and all will agree as to what they observed.

    An example would be reading a thermometer. No matter who observes the thermometer, it still displays the same temperature. The counterexample to this is physically sensing warmth or coolness. Observer A might sense that a room is warm, while observer B senses that the same room is cool.

    These observations differ depending on the observer, and are therefore considered subjective.

    Evidence that is not dependent on the observer (i.e., is objective), that appears the same no matter who observes the evidence, is considered to be empirical evidence.

  • BurnTheShips
    BurnTheShips
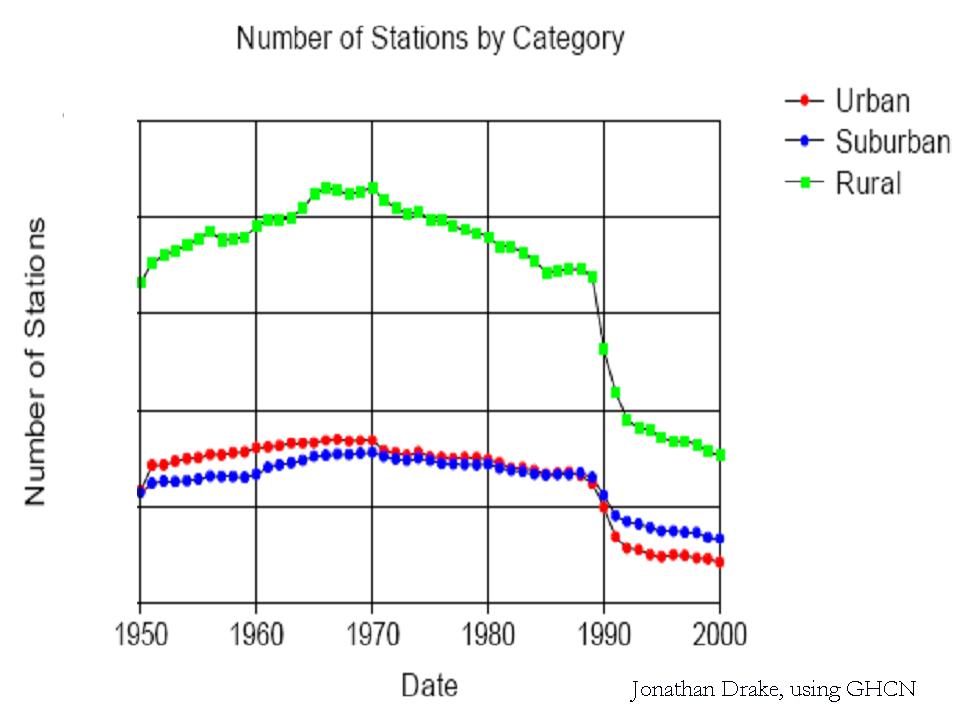
    How do you account for the divergence in the correlation between solar activity and global temperature since 1975?

    Station dropout since 1975. Reduction in temperature stations is overwhelmingly rural:

    Lets play "find the temperature station":

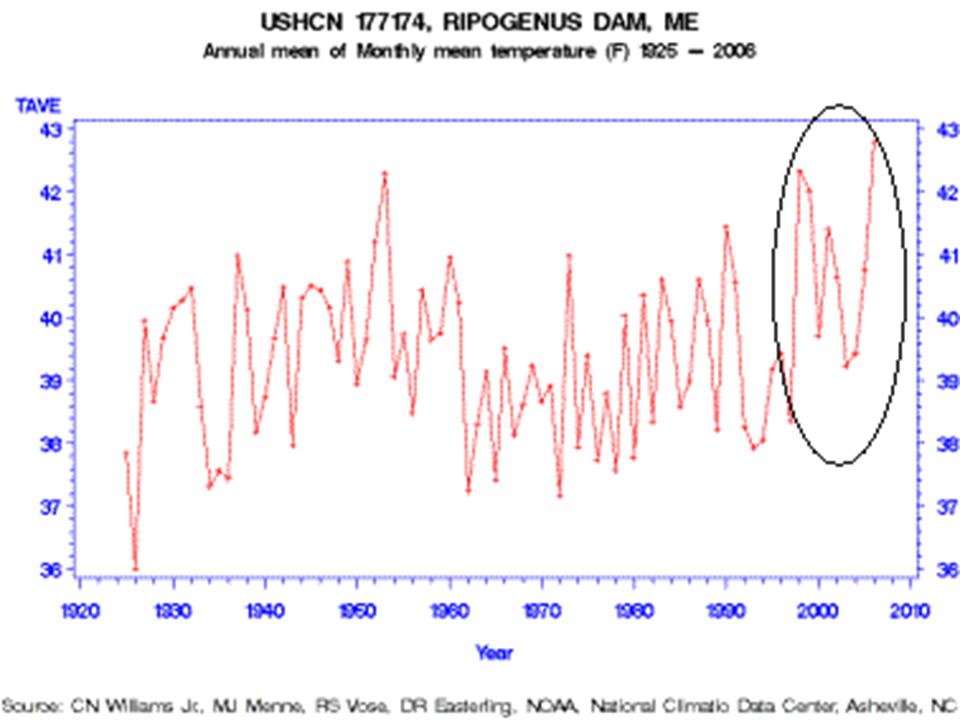
    The majority of US stations are poorly sited, and we are supposed to have the best in the world. We are also getting temperature readings from ghost stations that closed years ago. This one closed in 1995:

    Garbage in, garbage out.

    BTS

  • BurnTheShips
  • BurnTheShips
    BurnTheShips
    How do you account for the divergence in the correlation between solar activity and global temperature since 1975?

    The TSI reading on your chart could well be wrong.

    Empirical analysis of the solar contribution to global mean air surface temperature change.

    Journal of Atmospheric and Solar-Terrestrial Physics (2009),
    doi:10.1016/j.jastp.2009.07.007 By Nicola Scafetta

    Herein I have analyzed the solar contribution to global mean air surface temperature change. A comprehensive interpretation of multiple scientific findings indicates that the contribution of solar variability to climate change is significant and that the temperature trend since 1980 can be large and upward. However, to correctly quantify the solar contribution to the recent global warming it is necessary to determine the correct TSI behavior since 1980. Unfortunately, this cannot be done with certainty yet. The PMOD TSI composite, which has been used by the IPCC and most climate modelers, has been found to be based on arbitrary and questionable assumptions[Scafetta and Willson, 2009]*. Thus, it cannot be excluded that TSI increased from 1980 to 2000 as claimed by the ACRIM scientific team. The IPCC [2007] claim that the solar contribution to climate change since 1950 is negligible may be based on wrong solar data in addition to the fact that the EBMs and GCMs there used are missing or poorly modeling several climate mechanisms that would significantly amplify the solar effect on climate. When taken into account the entire range of possible TSI satellite composite since 1980, the solar contribution to climate change ranges from a slight cooling to a significant warming, which can be as large as 65% of the total observed global warming.

    *Here is the Scarfetta and Willson paper:

    A New Paper On Solar Climate Forcing “ACRIM-Gap And TSI Trend Issue Resolved Using A Surface Magnetic Flux TSI Proxy Model By Scafetta Et Al 2009

    The abstract reads:

    “The ACRIM-gap (1989.5-1991.75) continuity dilemma for satellite TSI observations is resolved by bridging the satellite TSI monitoring gap between ACRIM1 and ACRIM2 results with TSI derived from Krivova et al.’s (2007) proxy model based on variations of the surface distribution of solar magnetic flux. ‘Mixed’ versions of ACRIM and PMOD TSI composites are constructed with their composites’ original values except for the ACRIM gap, where Krivova modeled TSI is used to connect ACRIM1 and ACRIM2 results. Both ‘mixed’ composites demonstrate a significant TSI increase of 0.033%/decade between the solar activity minima of 1986 and 1996, comparable to the 0.037% found in the ACRIM composite. The finding supports the contention of Willson (1997) that the ERBS/ERBE results are flawed by uncorrected degradation during the ACRIM gap and refutes the Nimbus7/ERB ACRIM gap adjustment Fröhlich and Lean (1998) employed in constructing the PMOD.”

    A statement in the conclusion reads

    “This finding has evident repercussions for climate change and solar physics. Increasing TSI between 1980 and 2000 could have contributed significantly to global warming during the last three decades [Scafetta and West , 2007, 2008]. Current climate models [Intergovernmental Panel on Climate Change , 2007] have assumed that the TSI did not vary significantly during the last 30 years and have therefore underestimated the solar contribution and overestimated the anthropogenic contribution to global warming.”

    Garbage in, Garbage out.

    BTS

Share this

Google+
Pinterest
Reddit